 |
 |
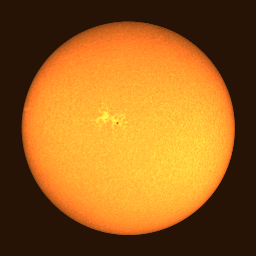
| a blue sodium image Jun 23, 1995 - 10:01:33 PST |
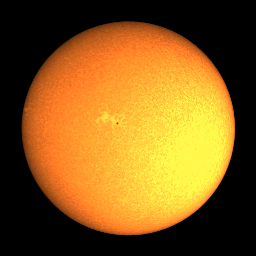
a red sodium image Jun 23, 1995 - 10:01:38 PST |
|---|
Helioseismolgy is a relatively new field of Solar Physics, whereby the internal structure and dynamics of the sun can be studied. Discovered in 1960 by Robert Leighton at the 60-FT Solar Tower, the sun was found to oscillate in a period of about 5 minutes. In other words, the sun experiences a solarquake every 5 minutes. Wavelike motions are not just confined to the surface; they also travel into the sun, where they get trapped in accoustical cavities. In 1970 Roger Ulrich devised the theory by which these solar harmonics could be studied. By monitoring these oscillations on the surface of the sun, solar physicists can indirectly monitor its internal dynamics, and learn more about what goes on inside the sun. This procedure is similar to how geophysicists learn about the internal structure of the earth by studying the motions of waves from earthquakes and man-made explosions. Since the sun is so active, helioseismologists can study the sun on a continuous basis to develop an internal model of the sun. To learn more about helioseismolgy see the link to http://helios.tuc.noao.edu/helio.html.
To monitor solar oscillations, a series of dopplergrams must be taken over a very long time. At the 60 Foot Solar Tower, dopplergrams are obtained by using a magneto-optical-filter (MOF). The MOF is a narrow-band filter which is composed of a vaporized alkaline-metal surrounded by a strong magnetic field. Currently, the 60-Foot Solar Tower uses a sodium MOF. The MOF works on the principles of the Righi and Zeeman effects on vaporized gas. Two separate components, red-shifted and blue-shifted light, are produced from the sodium absorption spectrum of the gas. A million pixel CCD camera then records the sun's image in the red and blue components of the sodium D lines.
 |
 |
| a blue sodium image Jun 23, 1995 - 10:01:33 PST |
a red sodium image Jun 23, 1995 - 10:01:38 PST |
|---|
The two images do not look uniform since the sun rotates on its axis. To say that an image is blue shifted means that we are looking at that part of the sun that is moving toward us, or the light is compressed to shorter wavelengths. Likewise, the opposite can be said about a red image. The two images can be added together to get a total intensity image, or an image that is composed of both red and blue components of the sodium D-lines.
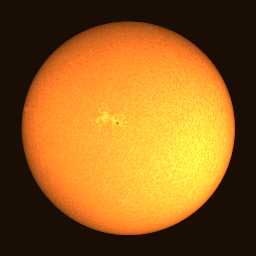 |
| red + blue = sum 10:01 PST |
|---|
On the other hand, a doppler image is a difference of the two component red and blue images. A doppler image reveals those individual areas of the sun that are either rising or sinking. In the following images, rotation can be seen. The left hand side of the 2 images is rotating toward the earth.
 |
 |
| (red - blue)/sum 10:01 PST |
(red - blue)/sum 10:03 PST |
|---|
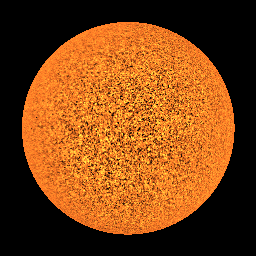
A red/blue pair of sodium images is taken once every minute with a separation of 5 seconds between the red and blue images. As a result, one dopplergram is computed once a minute for several hours during the day. The above two dopplergrams can be subtracted to obtain a velocity image map of the line-of-sight components of the rising and sinking regions of the sun. A two minute separation is chosen since 2 minutes is roughly half of a solar oscillation. The images below show doppler velocity of the sun at a two minute separation and at a three minute separation, to the left and right respectively. Light regions are rising and dark regions are sinking.
|
|
| 10:01PST - 10:03PST 2 min separation |
10:01PST - 10:04PST 3 min separation |
|---|---|
Since half of a solar oscillation cycle is roughly 2.5 minutes, the two images above stradle this midpoint. If you look closely, you can notice areas of the sun that have remained the same, and others that have started to change from rising to sinking, and sinking to rising. Imagine how a buoy would bob up and down on a choppy ocean. During the 5 minute cycle, a buoy floating just above the ocean surface would bob down and back up to its orginal position. By looking at the images as a stereo-pair, it is easier to see the differences.
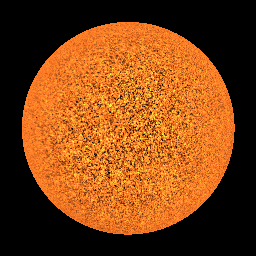
 A computer-generated simulation of the three-
dimensional structure of a single nonradial acoustic oscillation mode. The
red regions are where solar material is temporarily moving inward. The blue
regions are material that is moving outward. The sun can be in as many as
a million modes at any one time. This image is a representation of just one
of these modes. The doppler images above contain nearly 1000 of these
modes. Several fast, parallel processing computers are necessary to sort out
all of the modes of oscillation. Computers at JPL, Caltech and USC are used
to reduce the large data set that HiDHN produces.
Along with the high resolution images obtained with the 1024x1024 pixel camera, the project also observes with a second, smaller camera at nearly simultaneous times. This allows for observations of the sun in a different wavelength (in this case potassium). By studying the sun's oscillations in different wavelengths, solar physicists can look at different depths into the sun.
The second observing system utilizes a commercial Panasonic 649x493 pixel camera, and is controlled entirely through a 486PC-system. This portable and versatile system has allowed for development of a network of stations to be established in other parts of the world.
A second observing system has been installed at the Crimean Astrophysical Observatory (CrAO) in the Ukraine. The CrAO is 10.2 hours of longitude away from Mt. Wilson Observatory which allows for as long as 22 hours of continuous observations during the summer observing season. Soon, CrAO will be upgraded with a 1k pixel camera similar to the one at Mt. Wilson.
 ...back to 60-Foot Solar Tower Home Page